With Spot Bitcoin ETF approvals touted for early next year, the next crypto bull may be just around the corner. With this in mind, now more than ever is the time to get your analytical crypto indicators in order before the next influx of relentless DeFi bullishness.
As is the whole premise behind this article, analytical crypto indicators can essentially help us gauge the underlying health, activity, and trajectory of a respective cryptocurrency, which can then allow us to make more informed trading decisions. In turn, such knowledge base and new-found trading prowess could prove life-changing come the crypto market’s next rejuvenation and blow-up.
So without further ado, here is a list of the 10 best crypto indicators for hopeful traders.
The 10 Best Crypto Indicators
Daily Active Addresses
Daily active addresses (DAA) can also be labelled as unique wallet addresses that have been active on a respective network within a 24-hour period - be it sending or receiving funds.
Whether they’re tied to an individual or collective, DAAs are important as they essentially reveal how many users are interacting - and therefore somewhat interested - in a respective cryptocurrency.
Further, growth in DAAs indicates an increase in demand for a network and its corresponding currency… and vice versa . In turn - and ceteris paribus - demand increases/decreases can elicit the same effects onto the in-question token’s price (a sentiment to remember throughout this article).
Additionally, a high DAA figure indicates a healthy DeFi community with a thriving and well-engaged user base. On the flip side, a decline in DAA can indicate waning interest (and therefore value) in a token.
In taking things more technical, DAA can also be categorised into smaller metrics, which each tell us something different. For example, DAA tracking also measures new and zero-balance addresses - where as intuition suggests, a high figure for the former and a low future for the latter indicates maximum bullishness.
Caveat: DAAs are only recorded once, irrespective of the value and frequency of their transaction(s). Additionally, they only account for on-chain active wallets, meaning figures for the token’s overall demand (albeit not the network’s) can sometimes be higher.
As you’ll come to find out with other crypto indicators in this list, DAAs can be used to tell part of the story, with more being revealed when used alongside other metrics.
Daily Transactions & Fees
Closely tied to DAA are daily transactions and fees.
As the name suggests, the former represents the sheer activity volume on a blockchain over a single day, whilst the latter indicates the volume of fees in which users have paid to compensate for miners’ energy and resource consumption.
Whilst daily transactions are fairly intuitive to understand - as increases indicate increasing interest in a token - transaction fees are dynamic in nature, as individual fees often increase as network traffic (i.e. transactions) increase.
In turn, this means that both can often increase in tandem with one another - as a surge in the former can prompt an (unwelcomed) surge in the latter, and vice versa. Further, increases in both can also indicate a price pump (and again, vice versa).
Ultimately, daily transactions and fees can be used as supplementary crypto indicators for gauging a token’s immediate demand and network state.
Exchange Supply
The exchange supply crypto indicators tells us how much of a given token is stored on centralised exchange (CEX) wallets.
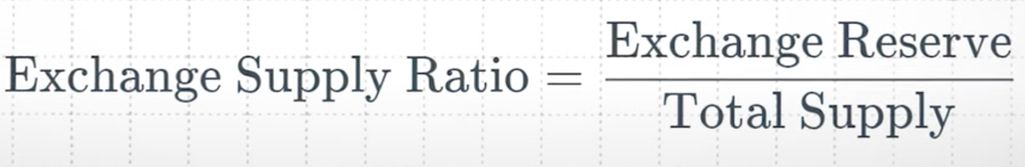
Often donated as a ratio (which divides a token’s exchange reserve figure by its total supply), a high exchange supply could indicate that holders are about to sell. In contrast, a low figure would indicate that holders are keeping their funds elsewhere (in a self-custody wallet for example), further inferring that they don’t intend to offload their tokens any time soon.
Further, with a high exchange supply ratio indicating imminent sales, you can expect a token to experience a fall in price. On the flip side, a token being vastly ‘hodled’ indicates healthy demand, and therefore possible price increases.
In one of the biggest caveats of this article, exchange supplies are often a very ambiguous metric to measure, as people could be storing funds on CEXs for various reasons, be it staking or interest, loans, or simply because they don’t appreciate the importance of storing funds via fully decentralised means.
With this in mind, never attribute too much importance to exchange supply rates, and always use such metric alongside others when determining the trajectory of a cryptocurrency’s value.
Market Value to Realise Value Ratio (MVRV)
The MVRV ratio compares a token’s current market price compared to its ‘real’ value.
To calculate such figure, the ratio divides what people are willing to pay right now (its total market value) by the realised value (which uses the ‘real’ or historical average price of all tokens currently in circulation).

Or in other words, the MVRV ratio tells us how valuable a token is compared to when it was first bought.
Typically, if the MVRV is above 1 (>1), the coin’s value is above its historical average. This means that it’s likely pumped at some point in time, and therefore may be on the cusp of declining (due to hype being maximised). Further an MVRV of above 3.7 (>3.7) indicates a price top.
In contrast, an MVRV of below 1 (<1) may indicate that a coin is undervalued.
Market Top/Bottom Crypto Indicators
The following collection of crypto indicators can be used for identifying market tops and bottoms.
First off is ‘net unrealised profit to loss’ (NUPL), which essentially shows us what traders’ crypto holdings are currently worth, versus what they paid for them.
Rather intuitively, if a NUPL rate is high, the respective holding is pumping in comparison to what it cost…therefore meaning it may be time to collect your bags and sell. On the flip side, a low NUPL rate may indicate a purchase opportunity (as prices are currently cheap)…or alternatively, it may indicate that a crypto holding has gone to zero (caused by poor trading decisions or a rug pull for example).
After NUPL there’s the self-explanatory metric of ‘addresses in profit’ - a metric that should usher-in caution if high, as profits may have already been realised.
A more nitty-gritty metric is ‘relative unrealised profit to loss,’ which essentially indicates whether traders are hodling for the long-run, or whether they’re being quick to cash-out once profits are available. Here, Bitcoin (BTC) maxis are a proficient example of the former, whilst degen memecoin traders looking for a quick-buck demonstrate the latter.
The final market top/bottom crypto indicator is investor sentiment, a more empirical and highly intuitive metric that can essentially tell us where a token’s price is likely heading…although also filled with BS, Twitter (X) is a good place for this.
When used together, these four crypto indicators can assist in traders aping-in and offloading at the optimal time.
Mining Revenue
Mining revenue is essentially the income miners receive for keeping a blockchain network secure and ticking…
Meaning with more network activity - and therefore demand for its corresponding token - miners have heavier workloads that offer more revenue-raking prospects.
To discover how much blockchain miners may be making, you can visit an array of blockchain explorers and on-chain data crunching platforms (which often host features such as ‘profitability calculators’).
Intuitively, high profits indicate a buzzing network that probably hosts a bullish token… and vice versa. Additionally, low profit margins may also indicate rising costs for miners, which again, is a bearish sentiment.
Hashrate
A blockchain’s hashrate is the measure of computational power (per second) used when mining (i.e. to secure and process transactions).
In short, a high hashrate indicates a secure network that requires a lot of computing power in order to secure (and therefore more effort for hackers to breach it).
By design, mining becomes more difficult as hash rates increase, due to the necessity for things to get more complex as more users join the ecosystem.
Again in short, hashrates can essentially self regulate themselves, as when mining gets too difficult (and expensive), miners leave, which then prompts hashrates - and therefore mining difficulty - to decline. In turn, such constant process of adjustment is what keeps blockchains such as Bitcoin running smoothly and seamlessly.
Ultimately, hashrates can tell us about the security of a blockchain, as well as the current state of mining difficulty. Paired with the metric of ‘mining revenue,’ it can therefore offer inferences regarding a blockchain’s health - therefore the demand for its associated token.
HODL Waves
‘HODL waves’ is a metric for identifying when a token’s ‘maxi’ population/hodlers believe it’s time to sell.
Further, this crypto indicator references three types of coins…lost/ancient coins (5+ years old), old coins (1-5 years old), and young coins (less than 1 year old).
As the name suggests, lost/ancient coins often never make a price resurgence - meaning if you ever see one being sold across exchanges, you can likely attribute this to diamond hand investors collecting their bags…so stay well away as demand is only going downwards!
Network Value to Transaction Ratio (NVT)
The NVT of a cryptocurrency describes the relationship between its market cap and transfer volume… or for the TradFi traders out there, it’s a metric that’s akin to the Price-to-Earnings (P/E) ratio.
In essentially determining whether a coin is over or undervalued, the ratio is calculated by dividing a coin’s market cap by its transaction volume (in terms of dollars per day).

To access such metric, you can visit on-chain analytics platforms such as Glassnode or Coin Metrics.
In short, a high NVT generally signals an overpriced asset, whilst a small NVT may indicate an opportunity to ape-in.
Additionally, sudden shifts in NVT ratios indicate new market conditions - with a NVT increase considered bearish as transactions are growing at a slower rate than its market cap. In contrast, downtrends indicate an undervalued asset, as transaction volumes are outpacing market cap increases.
As an extra pointer, such crypto indicator is useful when comparing tokens’ respective NVTs against each other, as traders can see which coins are being over and under valued at a particular point in time (and in relative terms).
Smart Money Labels
Smart money labels refer to the tracking of traders and institutional players with deep market knowledge/understanding.
Perhaps one of the most mindless of the entire list, this crypto indicator reveals the size of each alpha-driven crypto wallet…and more pivotally, their investment patterns and market foresight.
Through platforms such as Nansen, crypto traders can access a suite of smart money labels that essentially reveal who the industry’s experts are…
That is, who’s making the big bucks when it comes to trading and staking…as well as how they’ve devised their portfolios to do so.
So whilst doing your own research (DYOR) is always recommended, perhaps the next best thing is to ‘follow the smart money’ and copy such activity.
…Has Your Dad Asked What Crypto to Invest In?
And finally, there’s also an off-the-cuff crypto indicator that many successful crypto traders have pledged to follow…with this being the instant selling of all assets whenever a boomer shows interest in investing in crypto (i.e. it’s a sign that your exit liquidity may have arrived).
10 Best Crypto Indicators - Conclusion
To reiterate, the above crypto indicators often tell a ‘partial story’ in isolation, however when used alongside one another, a broader narrative regarding a coin’s potential trajectory can be observed.
Additionally, you can also use the alpha found through these methods with other on-chain insight innovations, which you can find here.
However, that being said, interpretation of all the mentioned metrics should always be preceded by research into the empirical sentiment and overall state of a respective cryptocurrency…as on-chain metrics can’t explain the entirety of this human-dictated industry.
10 Best Crypto Indicators - FAQ
What are the primary indicators in crypto trading?
Leading indicators in crypto trading are technical analysis tools that offer traders insights into potential future price movements. Common examples include the Relative Strength Index (RSI), Moving Average Convergence Divergence (MACD), and Stochastic Oscillator.
What is the optimal trading strategy in crypto?
There is no universal answer to this question, as the best trading strategy in crypto depends on individual preferences, risk tolerance, and trading style. Popular strategies include swing, trend, and day trading.
Which is the ultimate indicator for trading?
No single indicator reigns supreme in trading. Different indicators provide diverse information, making it crucial for traders to use a combination of indicators and analysis tools to validate decisions and reduce the risk of false signals.
Which is the most dependable indicator?
The reliability of an indicator in trading varies based on specific market conditions and the traded asset. Some commonly reliable indicators in crypto trading include the Relative Strength Index (RSI), Moving Average Convergence Divergence (MACD), and Bollinger Bands.
What are the four categories of indicators?
The four types of indicators in technical analysis are trend indicators, momentum indicators, volatility indicators, and volume indicators. Trend indicators help identify the trend direction, momentum indicators measure speed and strength, volatility indicators gauge price movement magnitude, and volume indicators assess trading activity.
Want More Cutting-Edge Crypto News?
Follow Us: X TikTok Instagram Telegram LinkedIn
Sign up to our newsletter at the bottom of the page
Check Out Our Top 10 Crypto Currencies of 2023
This article is intended for educational purposes and is not financial advice.