
Bitcoin has enjoyed a decent rally this year. Rallying by almost 100% since January, from a little above $15k in December 2022 to almost touching $32k in July. Now, it looks like Christmas is over and it’s time for the sellers to make bank.
Is this the end of the Bitcoin rally this year? Let’s dive into the technical analysis to see what the price action is saying.
Bitcoin Price Analysis: Weekly Timeframe

Source: Tradingview
Zooming out to the weekly timeframe, the price has recently concluded a retest of the double top neckline that was breached back in May 2022. Similarly, a familiar bear flag pattern has taken shape, and the current candlestick seems to have broken out of this flag pattern, suggesting that the price is prepared to resume its downward trend.
Bitcoin Price Analysis: Daily Timeframe

Source: Tradingview
Analyzing the daily chart provides a clearer perspective. On August 17th, the daily candlestick shattered the trendline, accompanied by strong bearish momentum. This indicates that either sellers are guarding the $31,000 range, or early buyers are cashing in and exiting their positions.
Although it's too early to conclude whether it's time to sell all holdings, we will closely monitor how the market responds to the $25k area. If the $25k level is breached, there's a possibility that BTC's price could descend to as low as the 2022 bottom around $16k zone.
Bitcoin On Chain Analysis
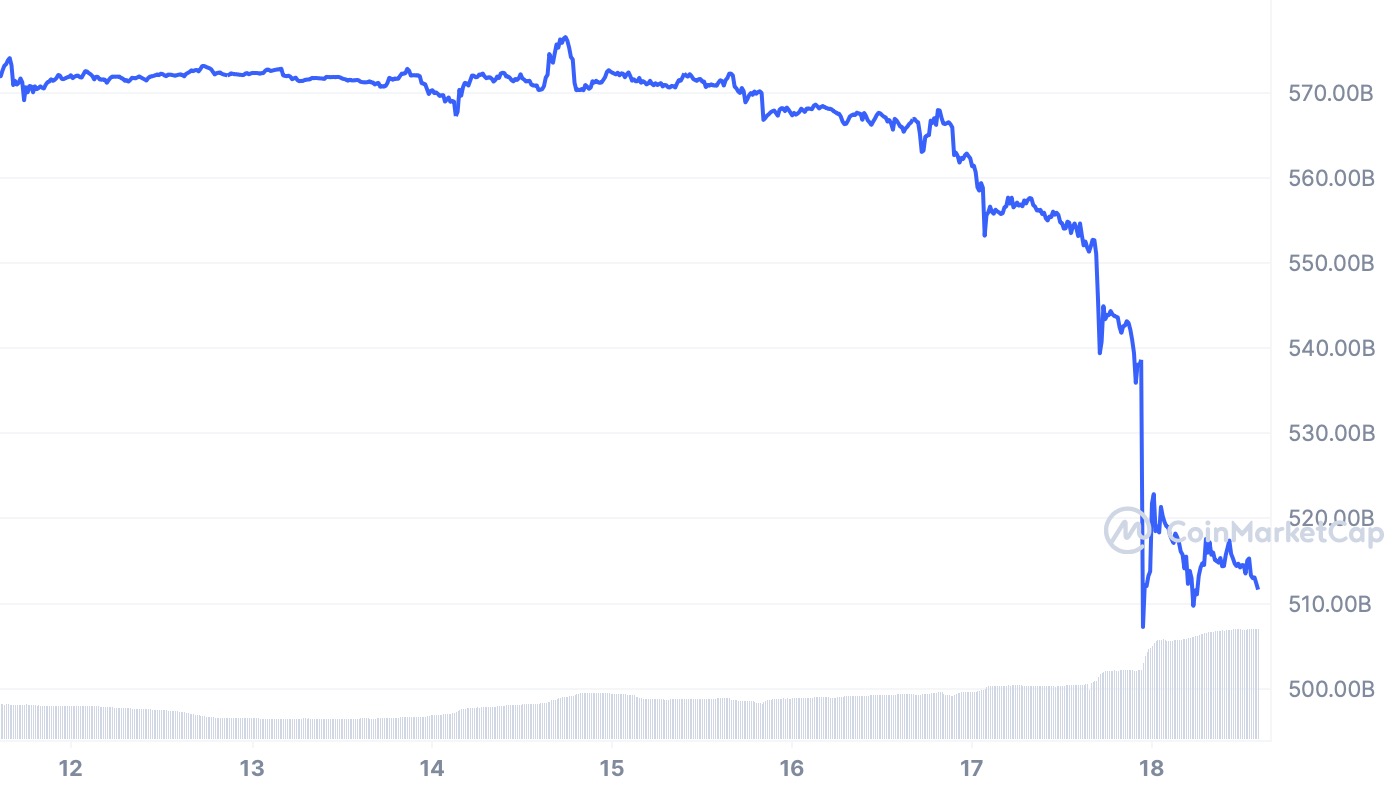
Source: Coinmarketcap
In the last 7 days, Bitcoin's market capitalization has experienced a decline of over 10%, dropping from $572 billion on August 12 to below $510 billion on August 18. However, during the same period, the 24-hour trading volume of Bitcoin has surged from approximately $10 billion to over $30 billion, indicating a remarkable increase of more than 300% in trading activities within just 7 days.
This shift in market cap and trading volume suggests a period of increased market volatility and trading activity. The huge drop in market cap might indicate a potential decrease in overall investor confidence or a shift in market sentiment. The surge in trading volume could be a result of traders and investors reacting to these price fluctuations, possibly trying to capitalize on short-term opportunities.
You should closely monitor these trends and consider factors such as market news, macroeconomic conditions, and regulatory developments to understand the full impact and potential outcomes of such fluctuations in market cap and trading volume.
Bitcoin Price Prediction
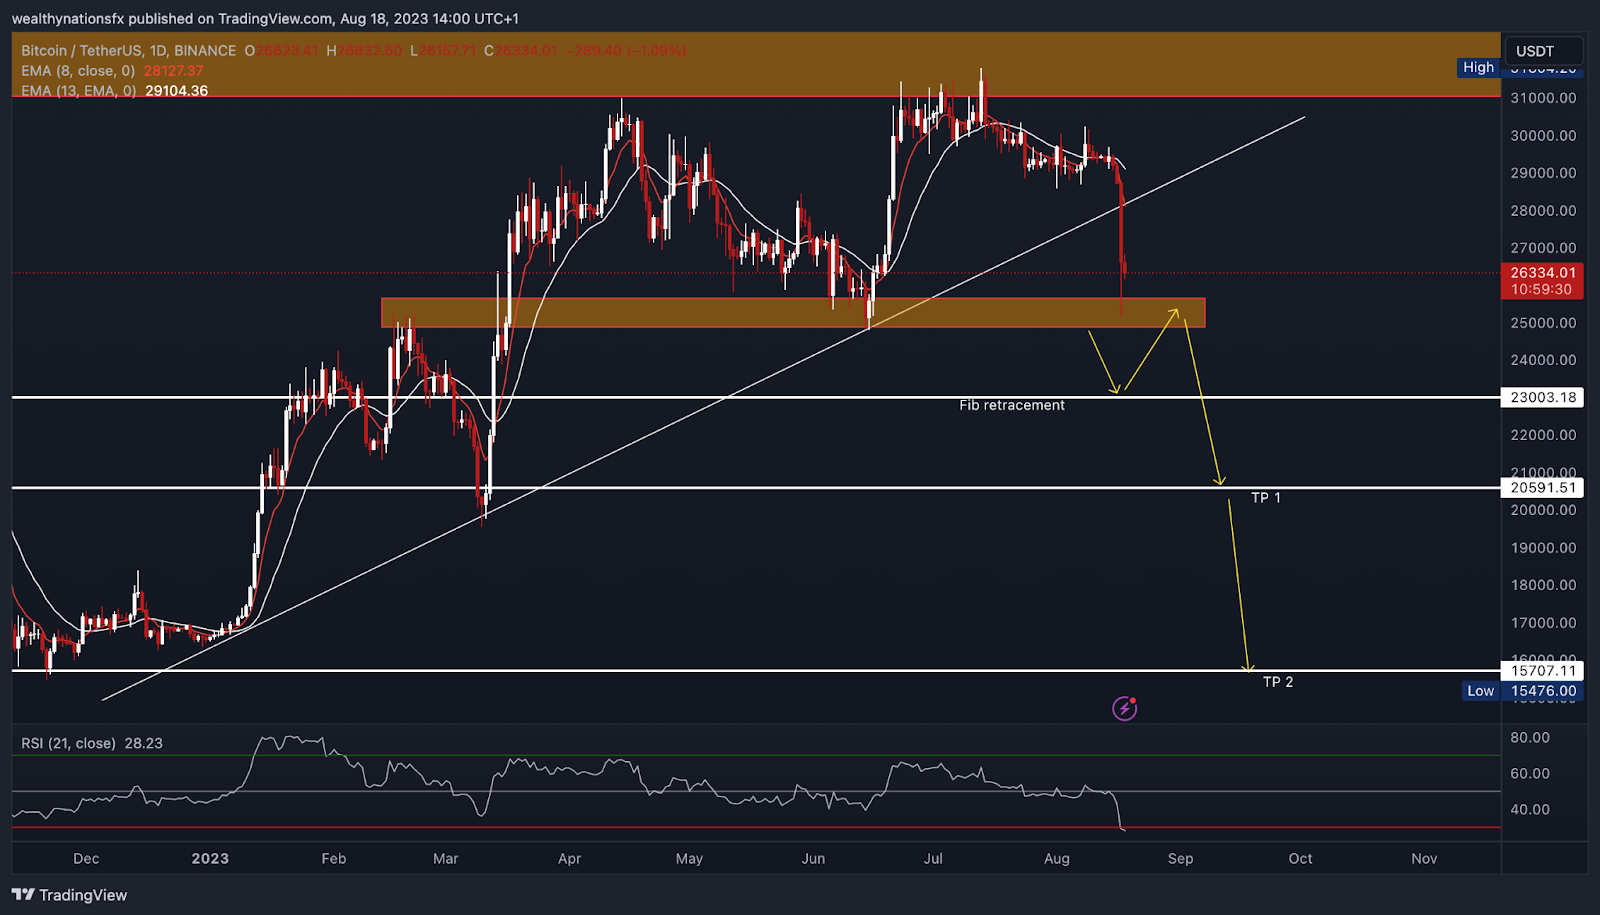
Source: Tradingview
Although it's too early to consider a short trade, you can certainly anticipate the market's next move. If the crucial $25k support level happens to break, we might see a drop to the $23k zone. On a smaller time frame, like the 4-hour chart, watch for a potential revisit of the $25k zone (now acting as resistance) before considering selling BTC.
To initiate a trade, follow these steps: wait for the zone to be breached, wait for the zone to be tested again, and keep an eye out for bearish continuation candlestick patterns like a bearish engulfing candle or an evening star formation – these would be the signals to sell.
This could also be a very good opportunity for investors looking to buy at a very low price. Wait for the price action to play out and monitor the market closely for the best time to enter.
This article is intended for educational purposes and is not financial advice.