Navigating the volatile world of cryptocurrency trading requires more than just an understanding of the market, it requires extensive knowledge of reading crypto charts.
Knowing how to read crypto charts is important, they are not just representations of price movements, they are essential tools that provide deep insights into market trends, investor sentiments and potential future price movements.
Understanding the different techniques and tools to learn how to read crypto charts is required to make an informed investment decision.
A list of different trading terminology can be found here.
Understanding The Basics Of Crypto Charts
In the volatile realm of cryptocurrency trading, success hinges not only on understanding the market but also on mastering the art of how to read crypto charts.
These charts are not just visual representations of price movements; they are indispensable tools that offer greater insights into market trends, investor sentiments, and possible future market directions.
Crypto charts are integral to trading, providing traders with a visual overview of market activity.
There are many ways to view charts this can be via tradingview, on an exchange like Binance or on coinmarketcap.
They help in identifying patterns, trends, and potential points of support and resistance.
This information is crucial for making informed decisions about entry and exit points in trading.
While the main use of crypto charts is to track price movements, they also serve a broader purpose.
They are analytical tools that can reveal the psychological state of the market, indicating whether investors are bullish or bearish. This insight is essential for predicting market behaviour.
Crypto charts offer a deeper understanding of market dynamics.
They help traders see beyond the surface-level price fluctuations and understand the underlying forces driving these changes.
This includes trading volumes, market momentum, and historical price patterns.
Effective chart analysis requires familiarity with various techniques and tools.
These include understanding candlestick patterns, trend lines, moving averages, volume indicators, and other technical analysis tools.
Each of these techniques provides a different lens through which to view market data, contributing to a more rounded and informed investment strategy.
Candlestick Patterns
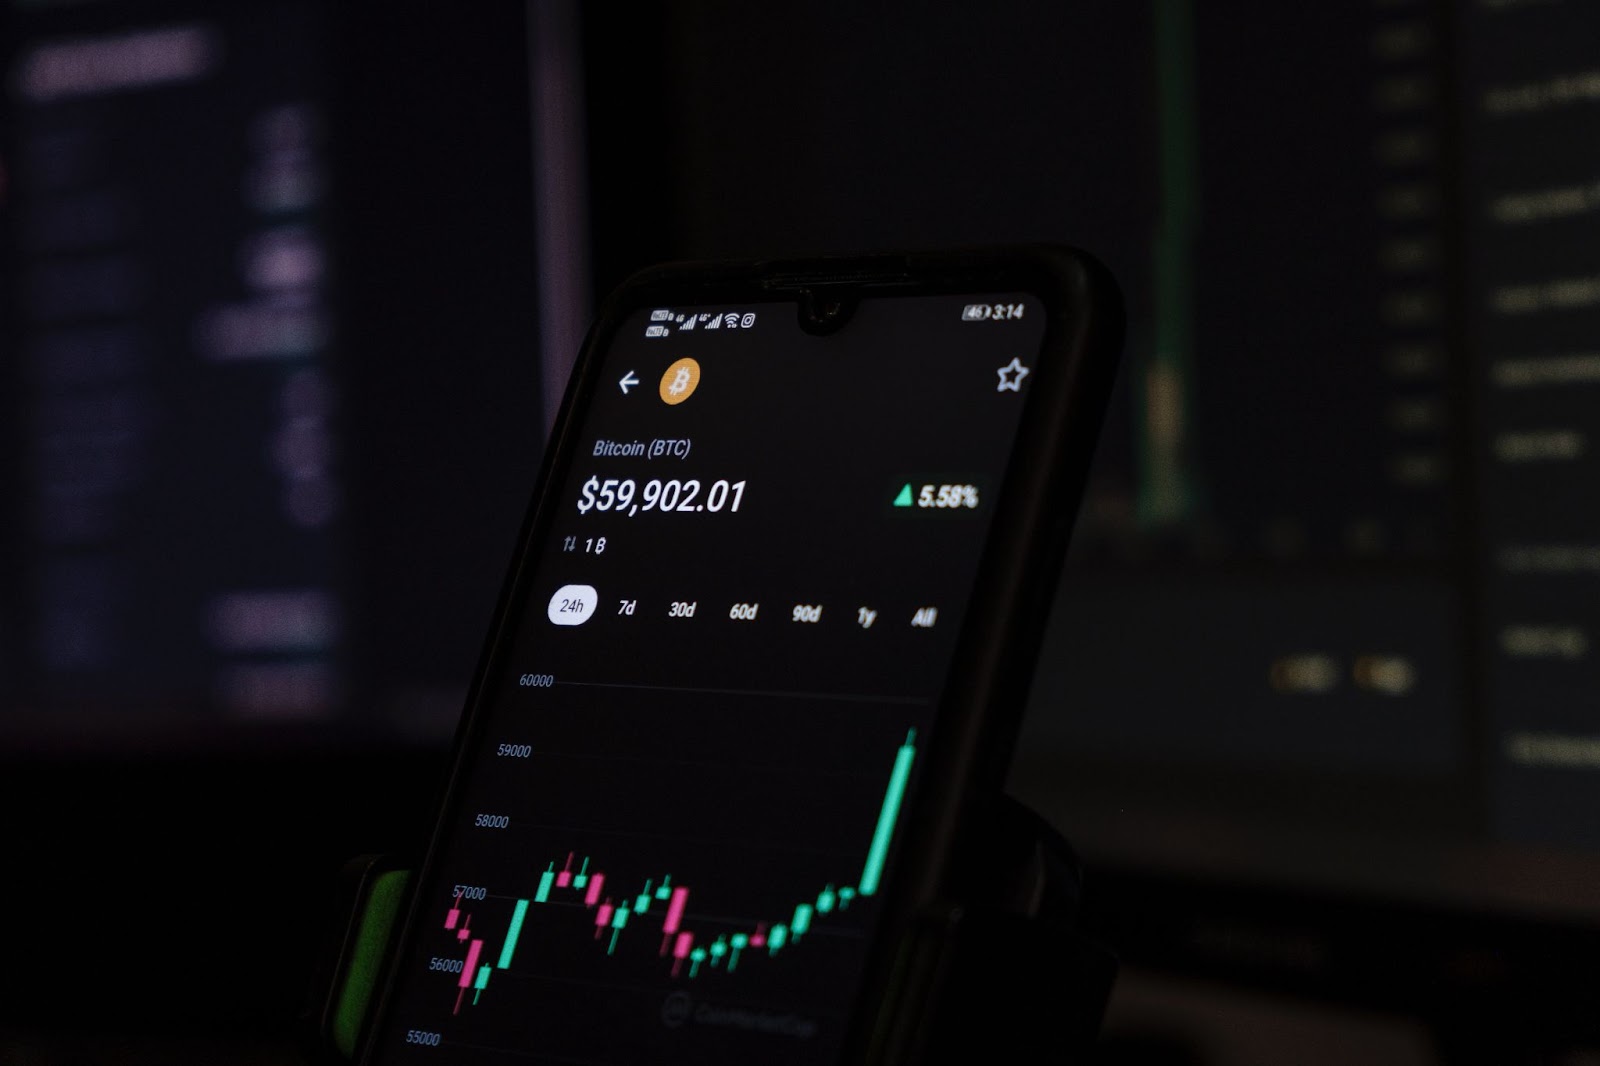
Candlesticks are the primary indicators of price activity in most cryptocurrency price charts. Each candlestick visually represents the price fluctuations of an asset within a specific time frame, such as 5 minutes, an hour, or a day.
A typical candlestick is composed of two parts: the body and the wicks.
-
The Body: This thicker part of the candlestick indicates the opening and closing prices of the asset within the selected time frame. If the closing price is higher than the opening price, the body is often coloured green indicating a price increase. Conversely, if the closing price is lower, the body is coloured red, signifying a price decrease.
-
The Wicks: Extending from the top and bottom of the body are the wicks, also known as tails or shadows. The wicks represent the highest and lowest prices reached during the time period of the candlestick. The range of the candlestick is the distance between these highest and lowest points.
On most crypto charts, colour coding is used to represent market movements.
-
Green Candlesticks: These typically signify a bullish move or a price increase. It means that the asset's price closed higher than its opening price within the specific time frame.
-
Red Candlesticks: These usually indicate a bearish move or a price decrease. It implies that the asset's price closed lower than its opening price.
Candlestick charts are more than just a way to show price changes; they provide crucial information about market sentiment and potential future price movements.
Traders analyse patterns formed by these candlesticks to make predictions and informed trading decisions.
Understanding how to read crypto charts starts with the nuances of candlestick charts and is therefore essential for anyone involved in cryptocurrency trading.
An example of candlesticks can be seen below.

Identifying Crypto Chart Patterns
To navigate the crypto market effectively, a trader must have a firm grasp of various chart patterns.
These patterns are crucial in signalling potential market movements, whether they indicate reversals or continuations in price trends.
For those keen to deepen their understanding of chart patterns, there are resources available that list and explain various patterns commonly seen in the crypto market.
These include patterns like head and shoulders, double tops and bottoms, flags, and triangles, each with its implications for market behaviour.
A list of different chart patterns can be found here.
Chart patterns play a vital role in technical analysis.
They are formations created by the price movements of cryptocurrencies on a chart and are used by traders to predict future market behaviour.
Recognising these patterns helps in forecasting whether the price is likely to rise, fall, or continue in its current direction.
Traders often develop specific strategies based on these chart patterns.
These strategies inform decisions on the best times to enter or exit a trade and where to set stop-loss orders to minimise potential losses.
The patterns provide insights into market sentiment and potential price movements.
Not all traders use the same trading methods, as individual preferences, risk tolerance, and trading goals vary.
This diversity means there are numerous strategies that a trader can employ, depending on their understanding of the market and personal trading style.
Analysis When Trading
Technical analysis in cryptocurrency trading involves utilising a variety of indicators to decipher chart information more effectively.
These indicators assist traders in understanding market trends, predicting future movements, knowing the differences between margin and futures trading and making informed trading decisions.
Technical analysis employs several indicators, each offering unique insights into market behaviour.
These indicators can include moving averages, Relative Strength Index (RSI), Bollinger Bands, Fibonacci retracement levels, and many others.
While there are numerous indicators available, certain ones are particularly favoured in the crypto trading community.
These include the Moving Average Convergence Divergence (MACD), Volume, and Stochastic Oscillator, among others.
A list of the 10 best crypto indicators can be found here.
An extensive A-Z list of different indicators for trading can be found here.
A crucial aspect of technical analysis is understanding support and resistance levels. Support refers to a price level where a cryptocurrency tends to stop falling and may bounce back up.
It's like a floor that the price doesn't easily break through downwards.
In contrast, resistance is like a ceiling level where the price tends to stop rising and may fall back.
These levels are identified based on historical price data and are key to predicting potential future price movements.
Mastering these tools and concepts is essential for any trader looking to navigate the volatile crypto markets effectively.
How To Read Crypto Charts - Final Thoughts
Mastering the art of how to read crypto charts is an ongoing journey.
This guide provides a foundational overview of how to interpret crypto charts, with a focus on candlesticks as the primary method of chart analysis.
As the market evolves, so too must your strategies and understanding of chart patterns, indicators, and other technical analysis tools.
If mastering crypto charts seems daunting, there are alternative approaches to participating in the market.
One such option is copy trading, where you can mirror the trades of experienced investors. Whether you choose to trade independently or explore options like copy trading, a solid understanding of market dynamics and chart analysis is essential for success in the crypto market.
FAQ
Why is it important to use different analysis techniques when crypto trading?
It is important to use a variety of trading techniques to give you the best way to make an informed decision.
What can you use if you don’t know how to read crypto charts?
If traders find it difficult to read crypto charts and trade they can do copy trading, this allows traders to copy experienced traders and learn from them in the process.
Why is it important to keep up to date with the latest news and trends?
Using technical analysis is helpful to predict future market movements, but if there is some news which can affect the market such as regulation changes, the analysis can be thrown out the window, so it is important to keep up to date with the latest information.
Want More Cutting-Edge Crypto News?
Follow Us: X TikTok Instagram Telegram LinkedIn
Sign up to our newsletter at the bottom of the page
Check Out Our Top 10 Crypto Currencies of 2023
This article is intended for educational purposes and is not financial advice.