
XRP price prediction
In this article, we will explore the factors influencing Ripple’s price, analyze its recent trends, and offer insights into XRP’s potential trajectory for the month ahead.
Ripple (XRP) Price Analysis: Daily Timeframe

Source: Tradingview
On August 17, Ripple (XRP) made a significant breakout of the 2023 trendline, but the candle quickly closed within the trend, and since then, there has been another attempt to break out of the trendline again. Currently, XRP is trading at $0.51, and a break of the trendline might expose the $0.4 region, which is the next support. If history is anything to go by, the wick formed on the daily candle of August 17 shows that XRP is currently experiencing a power tussle between buyers and sellers, and the sellers might soon overcome and succeed in pushing the price downwards. While the $0.5 level currently acts as a support, will it continue to hold?
Let us check how the price acts on the 4-hour time frame for a clearer view.
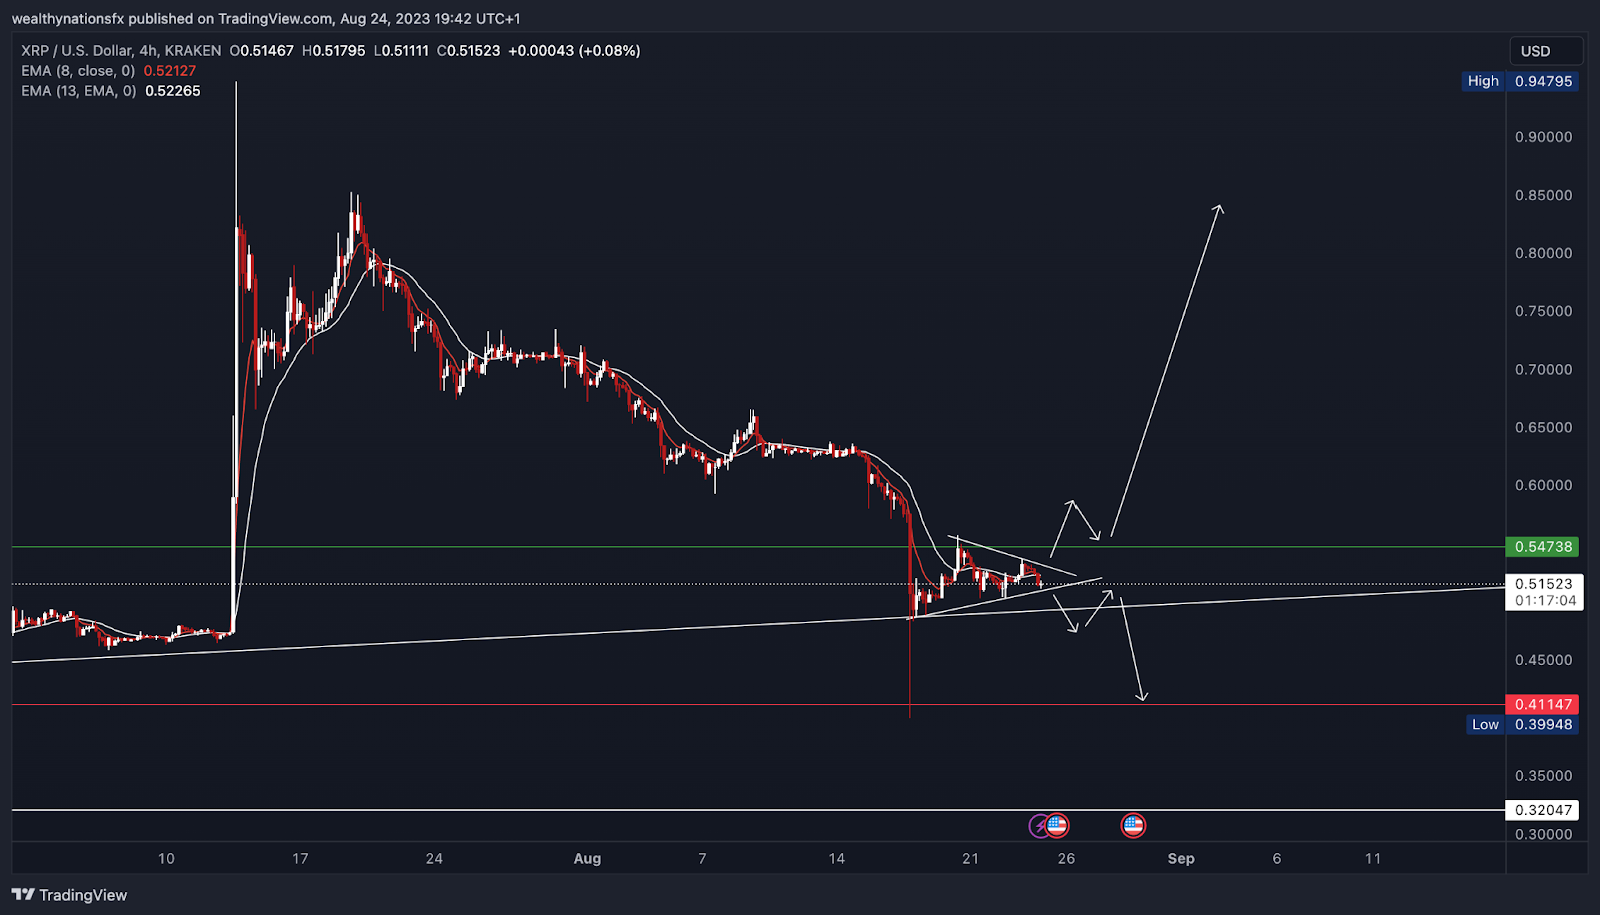
Ripple (XRP) Price Analysis: H4 Timeframe

Source: Tradingview
On the 4hr, we can see that the price is currently shaping up in a pennant chart pattern. This shows that the price is consolidating and might break out on either side. If the chart breaks out upwards, and we break out of the $0.54 resistance level (green line), we can see the price of XRP surge to the previous high of $0.84. However, if the pattern breaks downwards and the trendline acting as the outer support breaks, we can see the wick get filled, and the price will fall to the $0.4 region.
What’s Next For Ripple Price? XRP Price Prediction
In the current state of XRP, as explained earlier, there are two possible trading opportunities.
Firstly, if the pennant breaks upwards, we can see the price soaring back up to retest the initial high formed in July. Nevertheless, we need a break above the $0.55 resistance before that can happen. However, the break above this resistance is not a confirmed buy signal. It would be best to wait for multiple conformations such as EMA crossover upwards, bullish candlestick formations like Bullish engulfing, morning start, Etc.
On the other hand, a downward breakout of the pennant chart pattern will mean there is a possible sell opportunity. Wait for sell confirmations like a retest of the broken support, EMA crossover downwards, bearish candlestick formations like Bearish engulfing, etc.
Want more top-tier crypto market analysis?
Follow Us: X TikTok Instagram Telegram LinkedIn
Sign up to our newsletter at the bottom of the page
Check Out Our Top 10 Crypto Currencies of 2023
This article is intended for educational purposes and is not financial advice.